Visualising my Goodreads data |
 |
Visualising my Goodreads data
I had to push quite hard to reach my Goodreads reading goal for 2025. I finished Circe by Madeline Miller, my 40th book of the year, on the 27th of December. You can download your personal Goodreads data in your profile. Let’s analyze mine.
Inspection
Install pandas.
%pip install pandas
Load the data.
import pandas as pd

goodreads_data = pd.read_csv("goodreads_library_export.csv", parse_dates=["Date Added", "Date Read"])
Show information about “Circe”.
circe_info = goodreads_data[goodreads_data["Title"] == "Circe"]
info_subset = ["Title", "Author", "My Rating", "Date Added", "Date Read"]
circe_info[info_subset]
| Title | Author | My Rating | Date Added | Date Read | |
|---|---|---|---|---|---|
| 1 | Circe | Madeline Miller | 3 | 2025-12-22 | 2025-12-27 |
See how many books I’ve read in total.
goodreads_data['Exclusive Shelf'].value_counts()
Exclusive Shelf
read                 349
to-read                6
currently-reading      1
Name: count, dtype: int64
See how many books I’ve read in 2025.
books_read = goodreads_data[goodreads_data["Exclusive Shelf"] == "read"]
book_read_2025 =books_read[books_read["Date Read"].dt.year == 2025]
len(book_read_2025.index)
40
Visualising reading behaviour
Install matplotlib. Import numpy and matplotlib
%pip install matplotlib
import numpy as np
import matplotlib.pyplot as plt
Show how many books per year I’ve read and the linear trend.
books_per_year = (
    books_read.groupby(books_read["Date Read"].dt.year)
    .size()
)
# Fill missing years with 0
books_per_year = books_per_year.reindex(range(int(books_per_year.index.min()), int(books_per_year.index.max()) + 1), fill_value=0)

# fit a linear trend
books_per_year_z = np.polyfit(books_per_year.index, books_per_year.values, 1)
books_per_year_p = np.poly1d(books_per_year_z)

plt.figure(figsize=(6, 3))
plt.plot(books_per_year.index, books_per_year.values, marker="o")
plt.plot(books_per_year.index, books_per_year_p(books_per_year.index), "r--", alpha=0.8, label="Trend")

plt.title("Books read per year")
plt.xlabel("Year")
plt.ylabel("Books read")
plt.xticks(books_per_year.index, rotation=45)
plt.legend()
plt.grid(True, alpha=0.3)
plt.tight_layout()
plt.show()
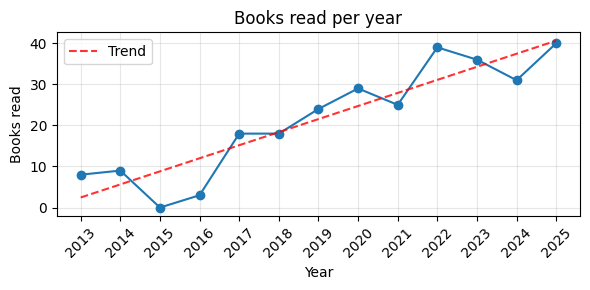
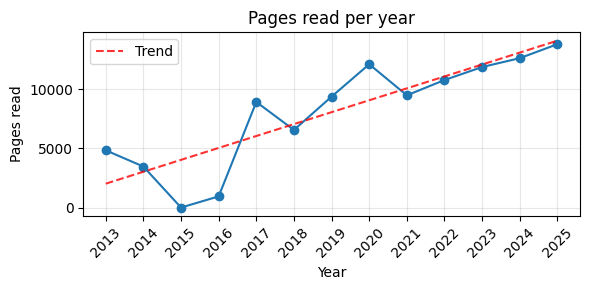
Nice! Looks like the number of books I read per year is trending upwards. Critical thinking: does reading more books automatically mean that I read more words? Maybe it’s more fair to plot the number of pages per year.
pages_per_year = (
    books_read.groupby(books_read["Date Read"].dt.year)["Number of Pages"]
    .sum(min_count=1)
    .sort_index()
)

# fill missing years with 0
pages_per_year = pages_per_year.reindex(range(int(pages_per_year.index.min()), int(pages_per_year.index.max()) + 1), fill_value=0)

pages_per_year_z = np.polyfit(pages_per_year.index, pages_per_year.values, 1)
pages_per_year_p = np.poly1d(pages_per_year_z)

plt.figure(figsize=(6, 3))
plt.plot(pages_per_year.index, pages_per_year.values, marker="o")
plt.plot(pages_per_year.index, pages_per_year_p(pages_per_year.index), "r--", alpha=0.8, label="Trend")
plt.title("Pages read per year")
plt.xlabel("Year")
plt.ylabel("Pages read")
plt.xticks(pages_per_year.index, rotation=45)
plt.legend()
plt.grid(True, alpha=0.3)
plt.tight_layout()
plt.show()
book_slope, pages_slope = books_per_year_z[0], pages_per_year_z[0]
book_mean, pages_mean = books_per_year.mean(), pages_per_year.mean()
book_normalized_slope, pages_normalized_slope = book_slope / book_mean, pages_slope / pages_mean

print(f"Books slope: {book_slope:.2f} books/year")
print(f"Pages slope: {pages_slope:.2f} pages/year")
print(f"Books normalized slope: {book_normalized_slope:.4f} (books/year/mean)")
print(f"Pages normalized slope: {pages_normalized_slope:.4f} (pages/year/mean)")
Books slope: 3.18 books/year
Pages slope: 1005.24 pages/year
Books normalized slope: 0.1477 (books/year/mean)
Pages normalized slope: 0.1249 (pages/year/mean)
The number of read books increases by 3.18 on average per year. The number of read pages increases by 1005.24 on average per year. The number of books increases more on average (14.77% of mean) than the number of pages (12.49% of mean). I can confirm this anecdotally, since having a Goodreads goal has caused me to pick up a few shorter reads in more recent years.
For our final visualisation let’s see which reading goals were met. This data is not present in the library export, but I can add it here by hand:
reading_goals = pd.DataFrame(
    {
        "Year": [2012, 2013, 2014, 2015, 2016, 2017, 2018, 2019, 2020, 2021, 2022, 2023, 2024, 2025, 2026],
        "Goal": [0, 0, 0, 0, 0, 20, 25, 25, 25, 25, 35, 40, 40, 40, 40]
    }
)
reading_goals
| Year | Goal |
|---|---|
| 2012 | 0 |
| 2013 | 0 |
| 2014 | 0 |
| 2015 | 0 |
| 2016 | 0 |
| 2017 | 20 |
| 2018 | 25 |
| 2019 | 25 |
| 2020 | 25 |
| 2021 | 25 |
| 2022 | 35 |
| 2023 | 40 |
| 2024 | 40 |
| 2025 | 40 |
| 2026 | 40 |
I had reading goals defined since 2017. I’ll set the reading goal in preceding years to 0.
from matplotlib.lines import Line2D
from matplotlib.patches import Patch

reading_goals["Books Read"] = reading_goals["Year"].map(books_per_year).fillna(0).astype(int)
reading_goals["Goal Met"] = reading_goals["Books Read"] >= reading_goals["Goal"]
colors = np.where(reading_goals["Goal Met"], "tab:green", "tab:red")

plt.figure(figsize=(6, 3))
plt.bar(reading_goals["Year"], reading_goals["Books Read"], color=colors, alpha=0.85)
plt.plot(reading_goals["Year"], reading_goals["Goal"], color="black", linestyle="--", marker="o")

legend_handles = [
    Patch(facecolor="tab:green", edgecolor="none", label="Goal met"),
    Patch(facecolor="tab:red", edgecolor="none", label="Goal not met"),
    Line2D([0], [0], color="black", linestyle="--", marker="o", label="Goal"),
]
plt.legend(handles=legend_handles)

plt.title("Reading goals vs books read")
plt.xlabel("Year")
plt.ylabel("Books")
plt.xticks(reading_goals["Year"], rotation=45)
plt.grid(True, axis="y", alpha=0.3)
plt.tight_layout()
plt.show()

Analysing my own “goal-picking” behaviour, it looks like I’ve increased my target almost every year after I hit a target. The exceptions are 2012-2016, during which I wasn’t actually using Goodreads yet, so this is more of an administrative issue than a reading issue, and this year (2026), because I only just made it to 40 books, and I actively sought out a couple of shorter books to get there.