Ark Nova (part 1) |
 |
What’s the opposite of sunk cost fallacy? I’ve played so much Ark Nova on the free tier of Board Game Arena, that getting a premium account now seems silly.
I would have easy access to statistics on my games if had a premium subscription. But boardgamearena.com/gamestats shows an HTML table element which I can download to start doing basic analyses. My latest game is shown as a row:
| Game | Time | Result | ELO |
|---|---|---|---|
| Ark Nova #XXXXXXX | 04/05/2026 at 15:14 50 mn |
1st: me (115) 2nd: opponent (106) |
5 → 462 |
Parsing the statstable
Pandas’ read_html method gives the <td> elements as flattened text:
import pandas as pd

html = pd.read_html("statstable.html", encoding="utf-8")
df = html[0].rename(columns={0: "game", 1: "time_info", 2: "result_info", 3: "elo_info"})
df.head(1)
| game | time_info | result_info | elo_info | |
|---|---|---|---|---|
| 0 | Ark Nova #XXXXXXX | 04/05/2026 at 15:1450 mn | 1stusername115 2ndopponent106 | 5 → 462 |
We can get the right structure with a few custom extraction functions:
from datetime import datetime

def parse_datetime(cell: str) -> datetime:
    """Parse '04/05/2026 at 15:1450mn' → datetime(2026, 4, 5, 15, 14)"""
    return datetime.strptime(cell[:19], "%m/%d/%Y at %H:%M")

def parse_duration(cell: str) -> int:
    """Parse '04/05/2026 at 15:1450mn' → 50"""
    duration_numbers = "".join([character for character in cell[19:] if character.isdigit()])
    return int(duration_numbers) if duration_numbers else 0

def parse_winner(cell: str) -> bool:
    """Parse '1stusername115 2ndopponent106' → True"""
    return cell[3:11] == "username"

def parse_delta(cell: str) -> int:
    """Parse '5 → 462' → 5"""
    return int(cell.split()[0])

def parse_new_elo(cell: str) -> int:
    """Parse '5 → 462' → 462"""
    return int(cell.split()[2])
The only games that fail this format are the ones where the table was abandoned. This was the case in 42 games:
abandoned_mask = df["elo_info"].str.contains("abandoned")
sum(abandoned_mask)
42
For the sake of simplicity, we can remove these games. We also apply all the parsing to get the information we want:
df = df[~abandoned_mask]
df["datetime"] = df["time_info"].apply(parse_datetime)
df["duration"] = df["time_info"].apply(parse_duration)
df["winner"] = df["result_info"].apply(parse_winner)
df["delta"] = df["elo_info"].apply(parse_delta)
df["new_elo"] = df["elo_info"].apply(parse_new_elo)
df = df[["datetime", "duration", "winner", "delta", "new_elo"]]
df = df.sort_values("datetime").reset_index(drop=True)
df.head(1)
| datetime | duration | winner | delta | new_elo | |
|---|---|---|---|---|---|
| 0 | 2026-04-05 15:14:00 | 50 | True | 5 | 462 |
Analyses
Play rate
first = df["datetime"].min()
last = df["datetime"].max()
n = len(df)
print(f"First game: {first:%m/%d/%Y}, last game: {last:%m/%d/%Y}, total games: {n}")
First game: 02/04/2024, last game: 04/05/2026, total games: 753
by_day = df.assign(day=df["datetime"].dt.date).groupby("day").size()
busiest_day = by_day.idxmax()
print(f"Most games in one day: {busiest_day} ({by_day.max()} games)")
Most games in one day: 2025-07-20 (9 games)
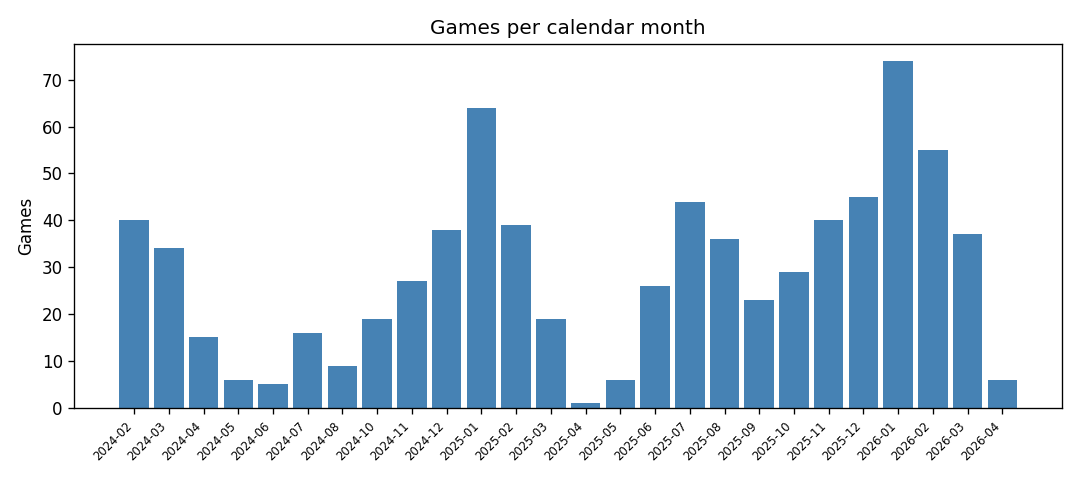
by_month_n = df.groupby(df["datetime"].dt.to_period("M")).size()
peak_period = by_month_n.idxmax()
print(
    f"Busiest calendar month: {peak_period.strftime('%B %Y')} ({by_month_n.max()} games)"
)
Busiest calendar month: January 2026 (74 games)
import matplotlib.pyplot as plt

by_month = df.groupby(df["datetime"].dt.to_period("M")).size()
fig, ax = plt.subplots(figsize=(9, 4))
ax.bar(range(len(by_month)), by_month.values, color="steelblue", width=0.85)
ax.set_xticks(range(len(by_month)))
ax.set_xticklabels([str(p) for p in by_month.index], rotation=45, ha="right", fontsize=7)
ax.set_ylabel("Games")
ax.set_title("Games per calendar month")
fig.tight_layout()
fig.savefig("games_per_month.png", dpi=120)
Win rate
win_pct = 100 * df["winner"].mean()
print(f"Overall win rate: {win_pct:.1f}%")
Overall win rate: 57.4%
exp_wr = df["winner"].expanding().mean()
fig, ax = plt.subplots(figsize=(9, 4))
ax.plot(df["datetime"], 100 * exp_wr, color="darkgreen")
ax.set_ylabel("Win rate (%)")
ax.set_xlabel("Game time")
ax.set_title("Cumulative win rate over time")
ax.set_ylim(0, 100)
fig.autofmt_xdate()
fig.tight_layout()
fig.savefig("winrate_over_time.png", dpi=120)
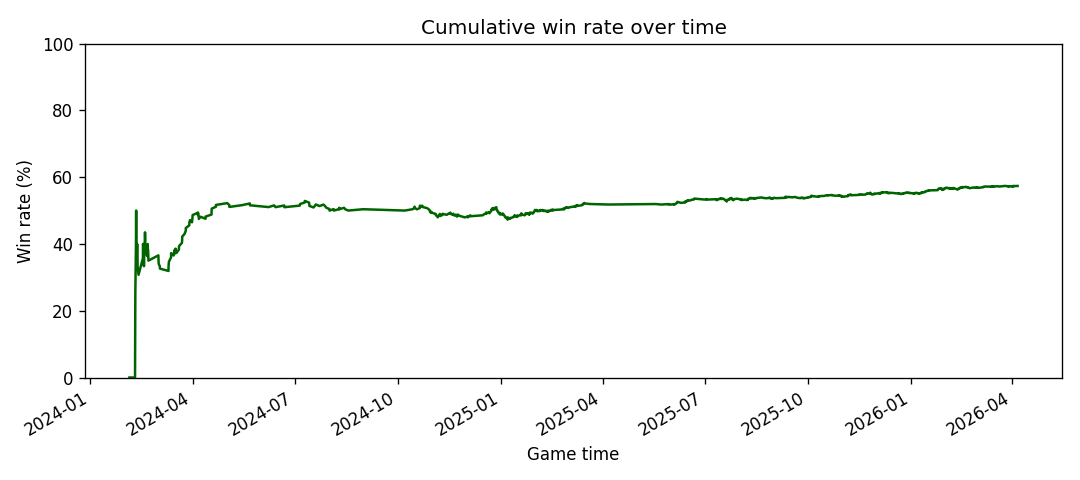
My win rate increased slightly over time. I do have to qualify that by saying I enjoy playing players of my own level more and might skip a match up with too much of a discrepancy of ELO (especially when they are much higher than me). I think this selecting behaviour is more impactful than me becoming a better player.
ELO progression
ELO progression is a better indication of skill. Everyone starts out with an ELO of 1.
elo_min = df["new_elo"].min()
elo_max = df["new_elo"].max()
imax = df["new_elo"].idxmax()
at_max = df.loc[imax, "datetime"]
print(f"Lowest ELO: {elo_min}, highest: {elo_max} on {at_max:%m/%d/%Y at %H:%M}")
Lowest ELO: 1, highest: 516 on 01/27/2026 at 11:28
fig, ax = plt.subplots(figsize=(9, 4))
ax.plot(df["datetime"], df["new_elo"], color="purple", linewidth=1)
ax.set_ylabel("ELO after game")
ax.set_xlabel("Game time")
ax.set_title("ELO progression")
fig.autofmt_xdate()
fig.tight_layout()
fig.savefig("arknova_elo_progression.png", dpi=120)
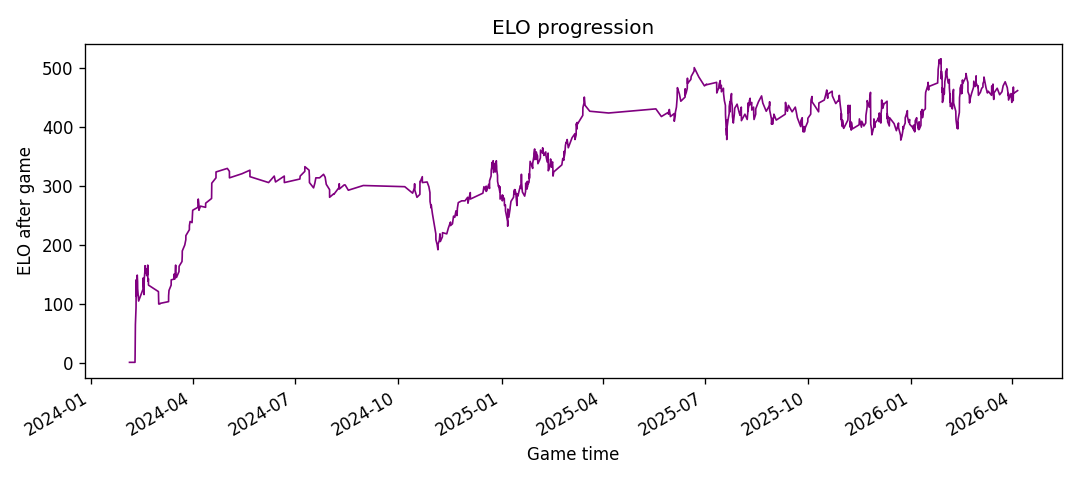
My ELO progression shows a long stretch in the low-to-mid 300s through much of 2024, then a climb through 2025 into the mid-400s.
Future
There are more analyses to be done. One thing I wonder about is, is how predictive earlier wins are for later wins (upswings and downswings). I have another thesis about how games tend to finish. I think more “luck” is involved in wins against higher ELO opponents, but modelling this purely based on score in very hard. Should I be able to get data from more games (not only my own) it would also be interesting to do an analysis of the (developing) meta of Ark Nova: which (combinations of) cards are (believed to be) strong?